Data Visualization with Plotly
note
For information about modifying this plugin or creating your own custom plugins, see Customize and Build Your Own Plugins.
For general plugin information, see Plugins for projects and Plugin FAQ.
About
Use Plotly to insert charts and graphs into your labeling interface. Charts are rendered in every annotation opened by a user.

Plugin
note
Plotly should be loaded first from CDN: https://cdn.plot.ly/plotly-2.26.0.min.js. For security reasons, it's better to use a hash for script integrity.
await LSI.import('https://cdn.plot.ly/plotly-2.26.0.min.js', 'sha384-xuh4dD2xC9BZ4qOrUrLt8psbgevXF2v+K+FrXxV4MlJHnWKgnaKoh74vd/6Ik8uF',);

let data = LSI.task.data;
if (window.Plotly && data) {
  Plotly.newPlot("plot", [data.plotly]);
}
Related LSI instance methods:
Labeling config
You need to add <View idAttr="plot"/> into your config to render the Plotly chart.
For example:
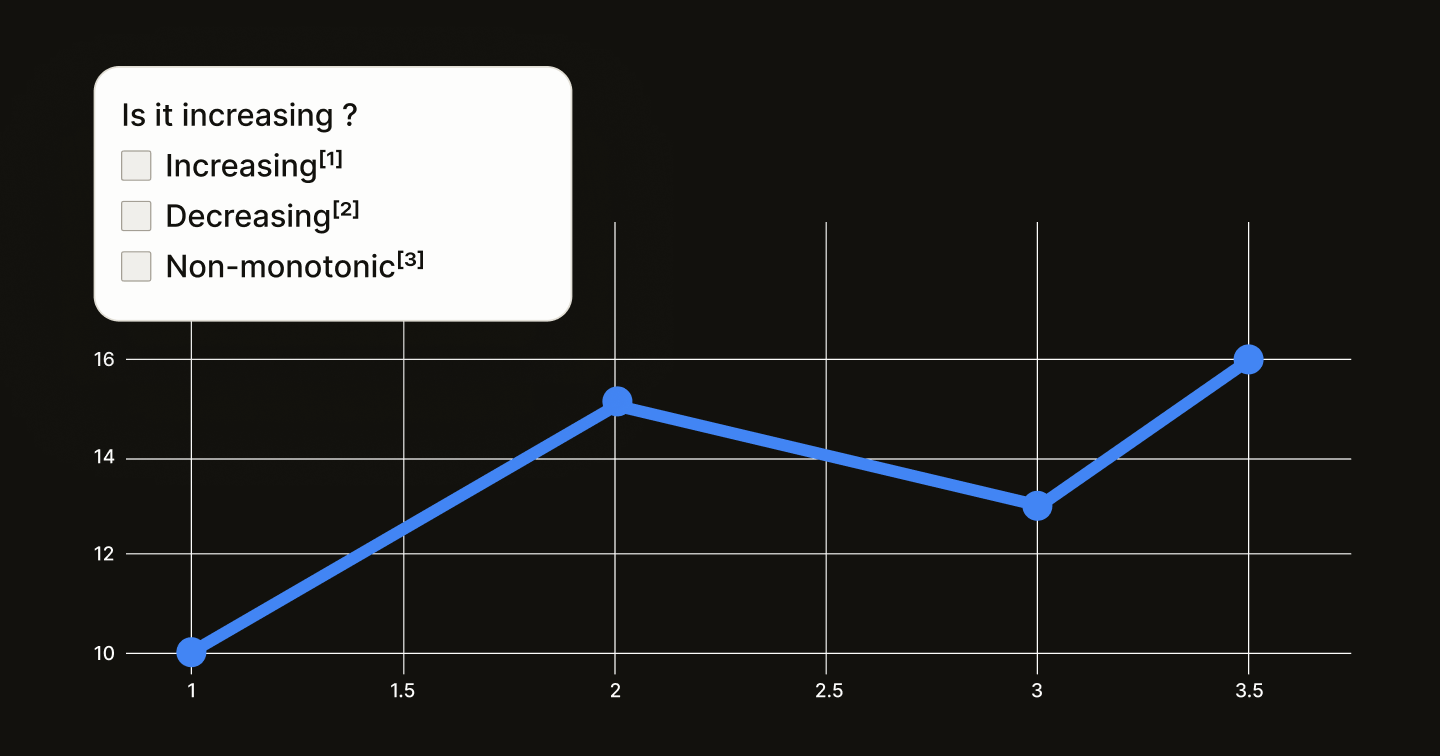
<View>
  <Text name="function" value="Is it increasing?" />
  <Choices name="slope" toName="function">
    <Choice value="Increasing" />
    <Choice value="Decreasing" />
    <Choice value="Non-monotonic" />
  </Choices>
  <View idAttr="plot"/>
</View>
Related tags:
Sample data
[
  {
    "plotly": {
      "x": [1, 2, 3, 4],
      "y": [10, 15, 13, 17],
      "type": "scatter"
    }
  },
  {
    "plotly": {
      "x": [1, 2, 3, 4],
      "y": [16, 5, 11, 9],
      "type": "scatter"
    }
  }
]