Use the Data Manager in projects
The Data Manager page is where you can view all your labeling tasks, sort and filter your data, import and export data, and perform various actions related to tasks.
For information on setting up a project, see Create and configure projects.
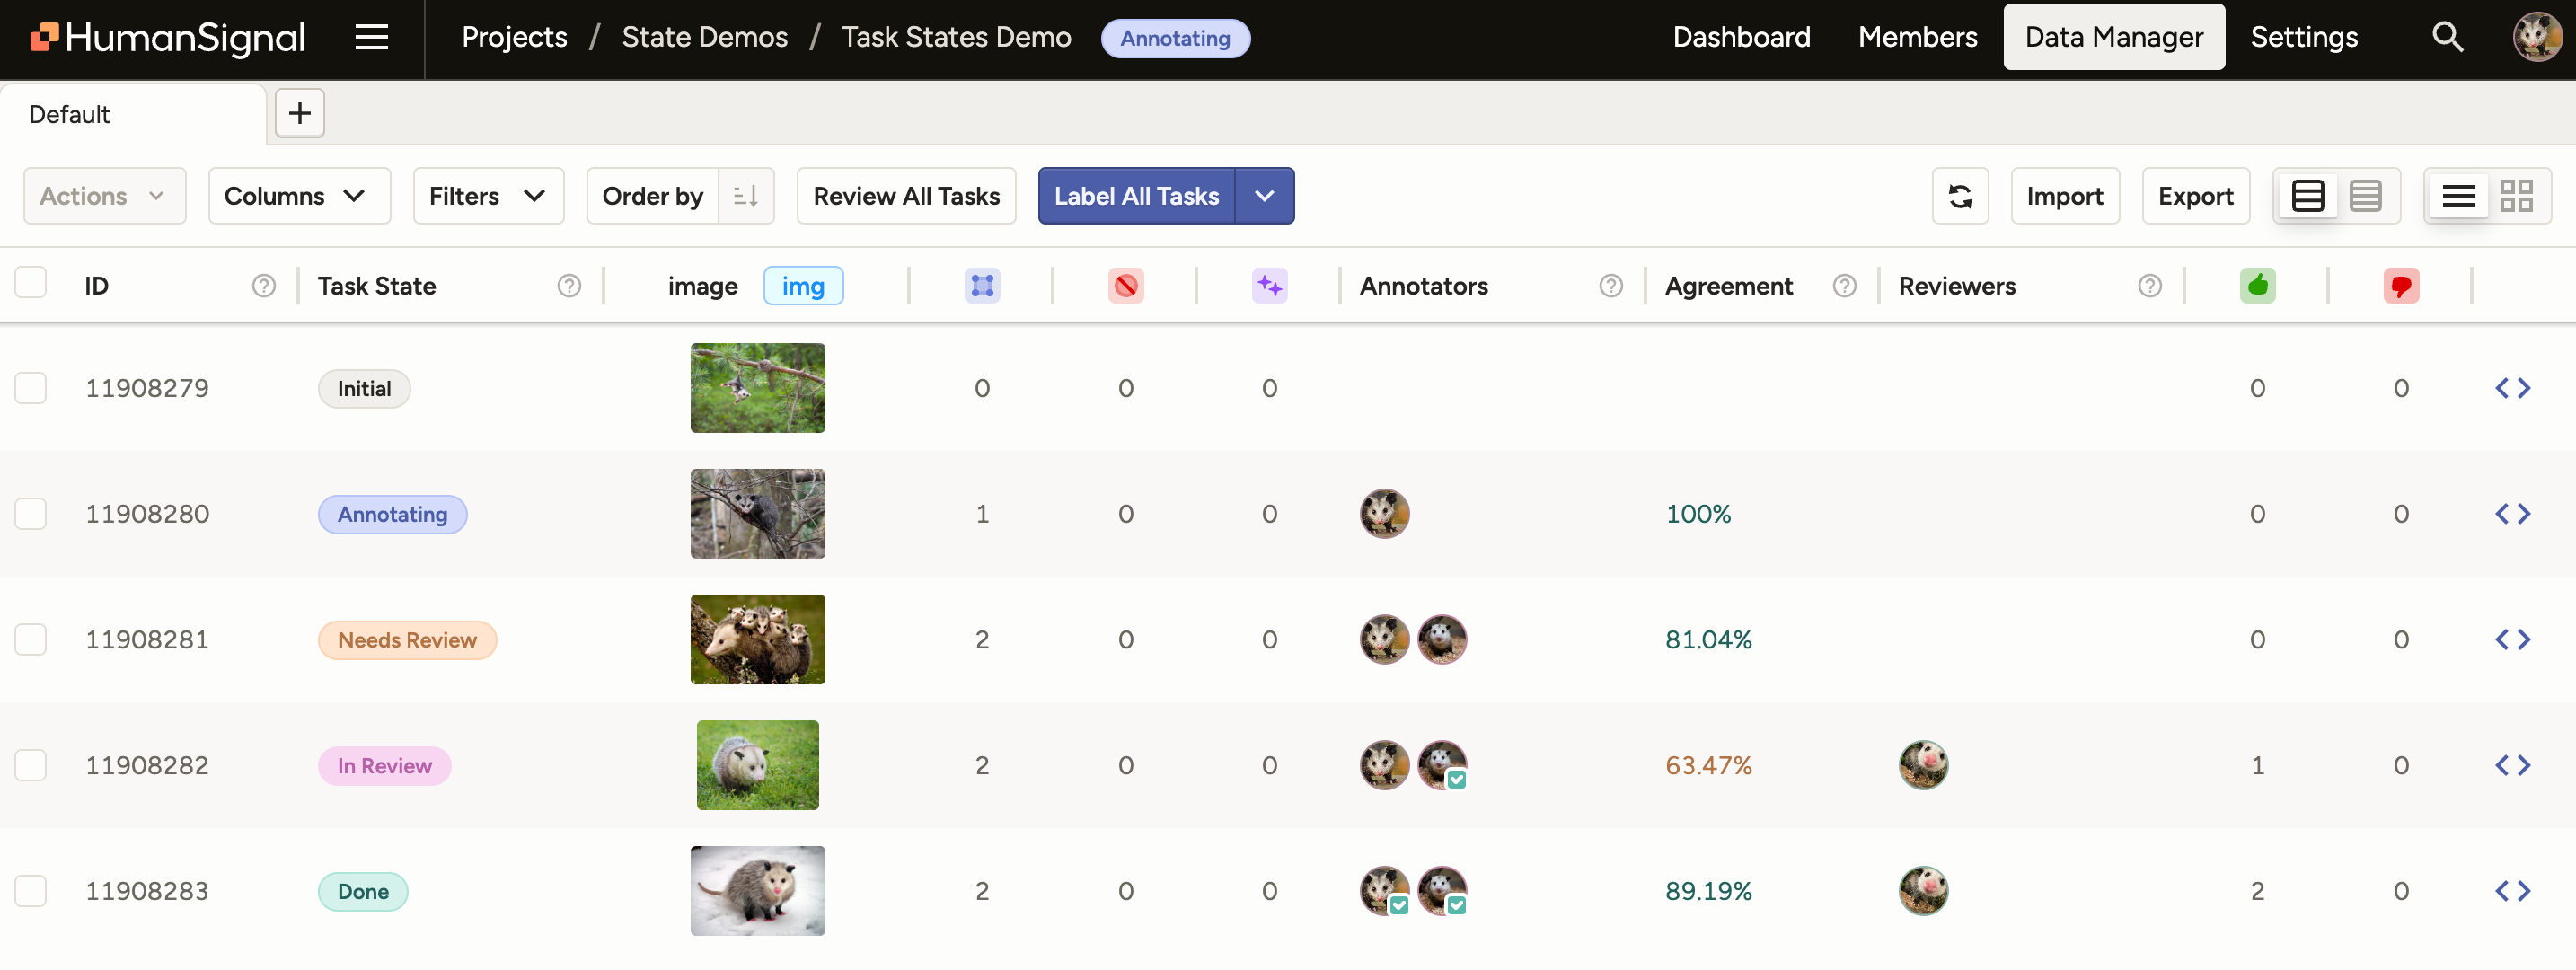
Every row in the data manager represents a labeling task in your dataset.
Task states
Each task progresses through a series of states as you take actions on it. For more information, see Project and Task State Management.
Filter or sort project data
With filters and tabs, you can split data into different sections to be labeled by different annotators, or set up data in a particular order to perform labeling according to prediction score, or another value in your data.
When you filter or sort the data before you label it, you modify which tasks and the order of the tasks you see when labeling. While task sampling affects the task order for an entire project and can’t be changed, filtering and sorting tasks can be changed at any time.
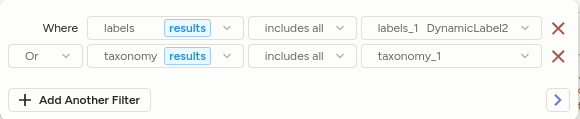
Filter annotation results
You can also filter on individual annotation results within a task:
note
In Label Studio Community, the Annotation results filter is an unstructured text search across all annotations for the task, and the example above would not be achievable.
The following tags are supported:
- All
Labelstags (ex.Labels,ParagraphLabels, …) ChoicesTaxonomyRating
Known limitations:
- Taxonomies loaded using
apiUrlwill not be detected.
Example: Label new data first
Sort the data in your project by date to focus on labeling the newest data first.
- In a project, update the Order of the data from the default to Created at.
- Update the order of the items to be in ascending order, so the newest items appear first.
- Select Label Tasks As Displayed to start labeling tasks from newest to oldest.
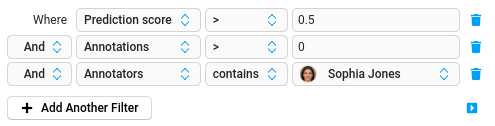
Example: Sort by prediction score
You can sort the data in your project by prediction score if you upload pre-annotated data with prediction scores, or if your machine learning backend produces prediction scores as part of the model output.
- In a project, update the Order of the data from the default to use the Prediction score field.
- Update the order of the items in either ascending or descending order to label based on higher confidence or lower confidence predictions.
- Select Label Tasks As Displayed to start labeling tasks in prediction score order. You can also use task sampling to use prediction score ordering.
Example: Split a dataset using tabs and filters
If you want to label a large dataset, you might want to use tabs and filters to split it up into smaller sections, and assign different annotators to different tabs. You can’t assign annotators to specific tasks in Label Studio Community Edition, but you can rename the tabs after specific annotators as a way to basically assign tasks using tabs.
For example, you might split a dataset with 300 images into 3 different tabs, and have different annotators focus on each tab:
- In a project, create a filter where the ID field is between the values “1” and “100”. Click away from the filter to review filtered items the tab.
- Click the vertical ellipsis for the tab and select Rename. Name it after a specific annotator that you want to focus on the items in that tab.
- Click the + icon to create a new tab. Click the vertical ellipsis for the new tab and select Rename to name it after a second annotator.
- On the new tab, create a filter where the ID field is between the values “101” and “200”. Click away from the filter to review the filtered items on the tab.
- Click the + icon to create a new tab. Click the vertical ellipsis for the new tab and select Rename to name it after a third annotator.
- On the new tab, create a filter where the ID field is between the values “201” and “300”. Click away from the filter to review the filtered items on the tab.
- Any annotator can log in and navigate to the relevant tab for their work and click the Label button to start labeling the subset of tasks on their tab.
Save filters as tabs
You can create tabs on the data manager to split your dataset for labeling, to separate tasks by status (annotated, predicted, unlabeled), or other reasons.
Tabs that you create depend on your labeling configuration setup, because the labeling configuration defines the data fields available for filtering and sorting.
note
If you make changes to the labeling configuration, any tabs in your data manager are removed. Make sure to finish the project setup before setting up complex tabs in the Data Manager.
Assign annotators to tasks
In Label Studio Enterprise, if you’re an administrator or project manager, you can assign annotators to tasks in a specific project. After you add the annotator to the project or workspace, assign the annotator to specific tasks. You must assign annotators to tasks if you’re using manual task distribution.
- For a specific project, select tasks on the Data Manager.
- Select the dropdown and choose Assign Annotators.
- Select names of annotators and click the
>arrow to assign them to the selected tasks. - Click Assign.
If you want to bulk assign tasks, you can use filters to identify exactly the tasks that you want to assign, then select the top checkbox on the data manager to select all tasks shown and assign them to an annotator.
Delete tasks or annotations
If you have duplicate tasks, or want to remove annotations, you can delete tasks and annotations from Label Studio.
- In Label Studio UI, open the project you want to update.
- Filter the Data Manager page to show only the data you want to delete. For example, specific annotations, or tasks annotated by a specific annotator.
- Select the checkboxes for the tasks or annotations that you want to delete.
- Select the dropdown with the number of tasks, and choose Delete tasks or Delete annotations.
- Click Ok to confirm your action.
If you want to make changes to the labeling interface or perform a different type of data labeling, first select all the annotations for your dataset and delete the annotations.
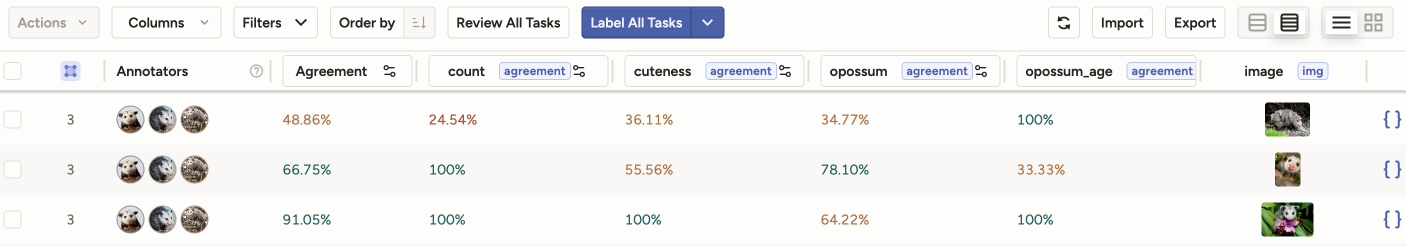
Agreement columns
The agreement columns in the Data Manager reflect consensus between annotators for a task. For more information on agreement and how it is calculated, see Task agreement.
You will see the following agreement columns in the Data Manager:
Agreement - The is the overall agreement for the task.
This is calculated as the mean agreement score between all control tags for a particular task. See Overall agreement.
[Control tag] agreement - Each control tag has its own agreement score.
How control tag agreement is calculated depends on how your project is set up. See Per-control-tag agreement.
Annotators and models
Click any agreement column to select specific annotators and models that you want to use for agreement calculation.
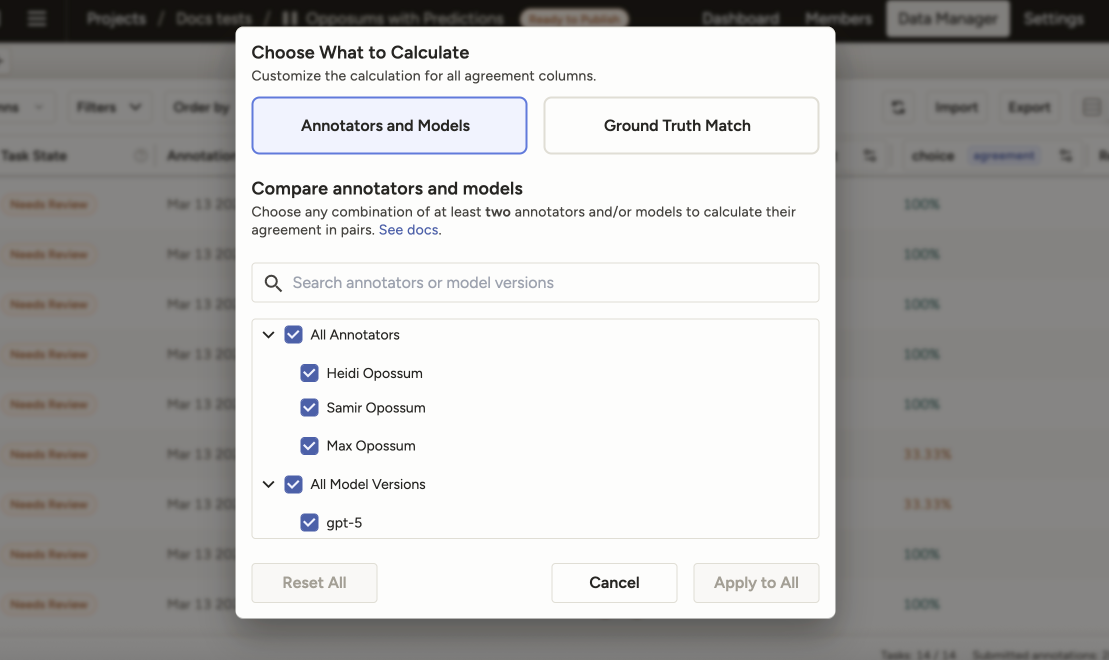
By default, all annotators (and not models) are selected for agreement calculation.
However, you can customize this to select a subset of annotators, models, or models and annotators to compare.
For example, if you have 10 annotators and you select 3, the overall agreement score and the control tag agreement scores will be recalculated to reflect only your selections.
note
You must select at least two items to compare.
Your selections will apply to all agreement columns in the Data Manager. You cannot select different annotators and models for different agreement columns.
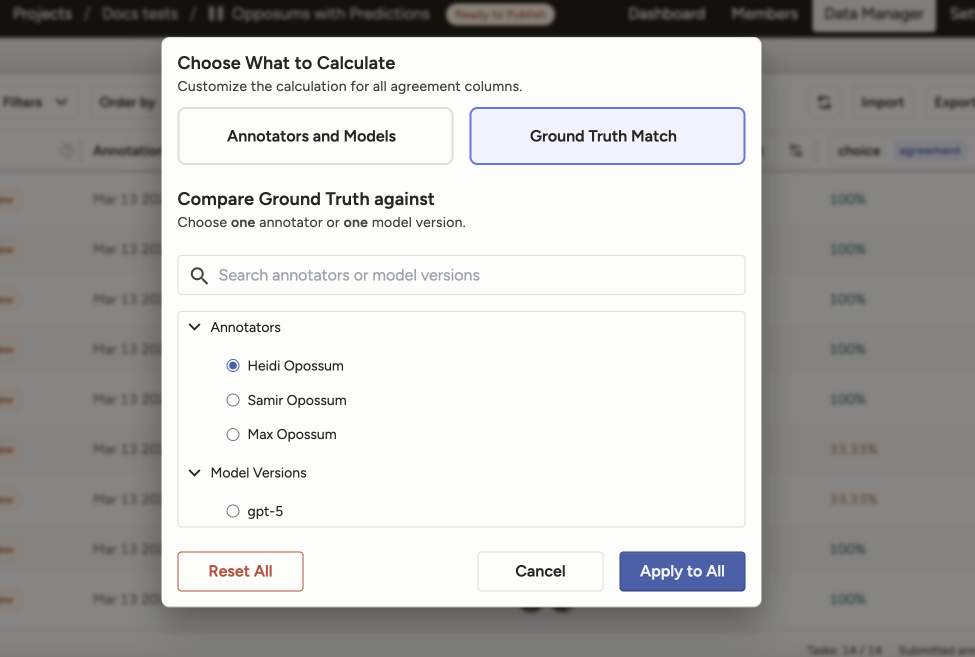
Ground truth match
If your project contains ground truth annotations, you can use this option to compare either a single annotator or a single model to ground truth annotations.
Label Studio will apply whatever agreement metrics and methodology you have configured for your project, but will limit the calculation to the selected annotator or model and the annotations marked as ground truth.
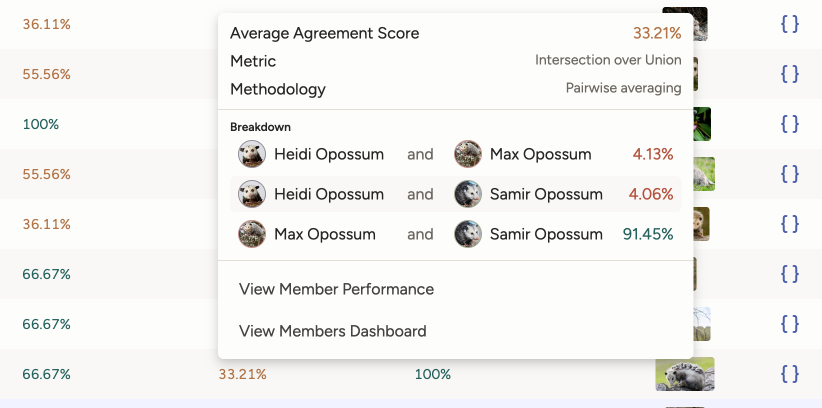
Agreement popover
Click any agreement column to see a popover that has information about the metric and methodology used.
If you are using Pairwise methodology, you will see a breakdown of agreement scores for the selected annotators and models.