Members dashboard
Get insight into the performance, agreement, and quality of members working on a project.
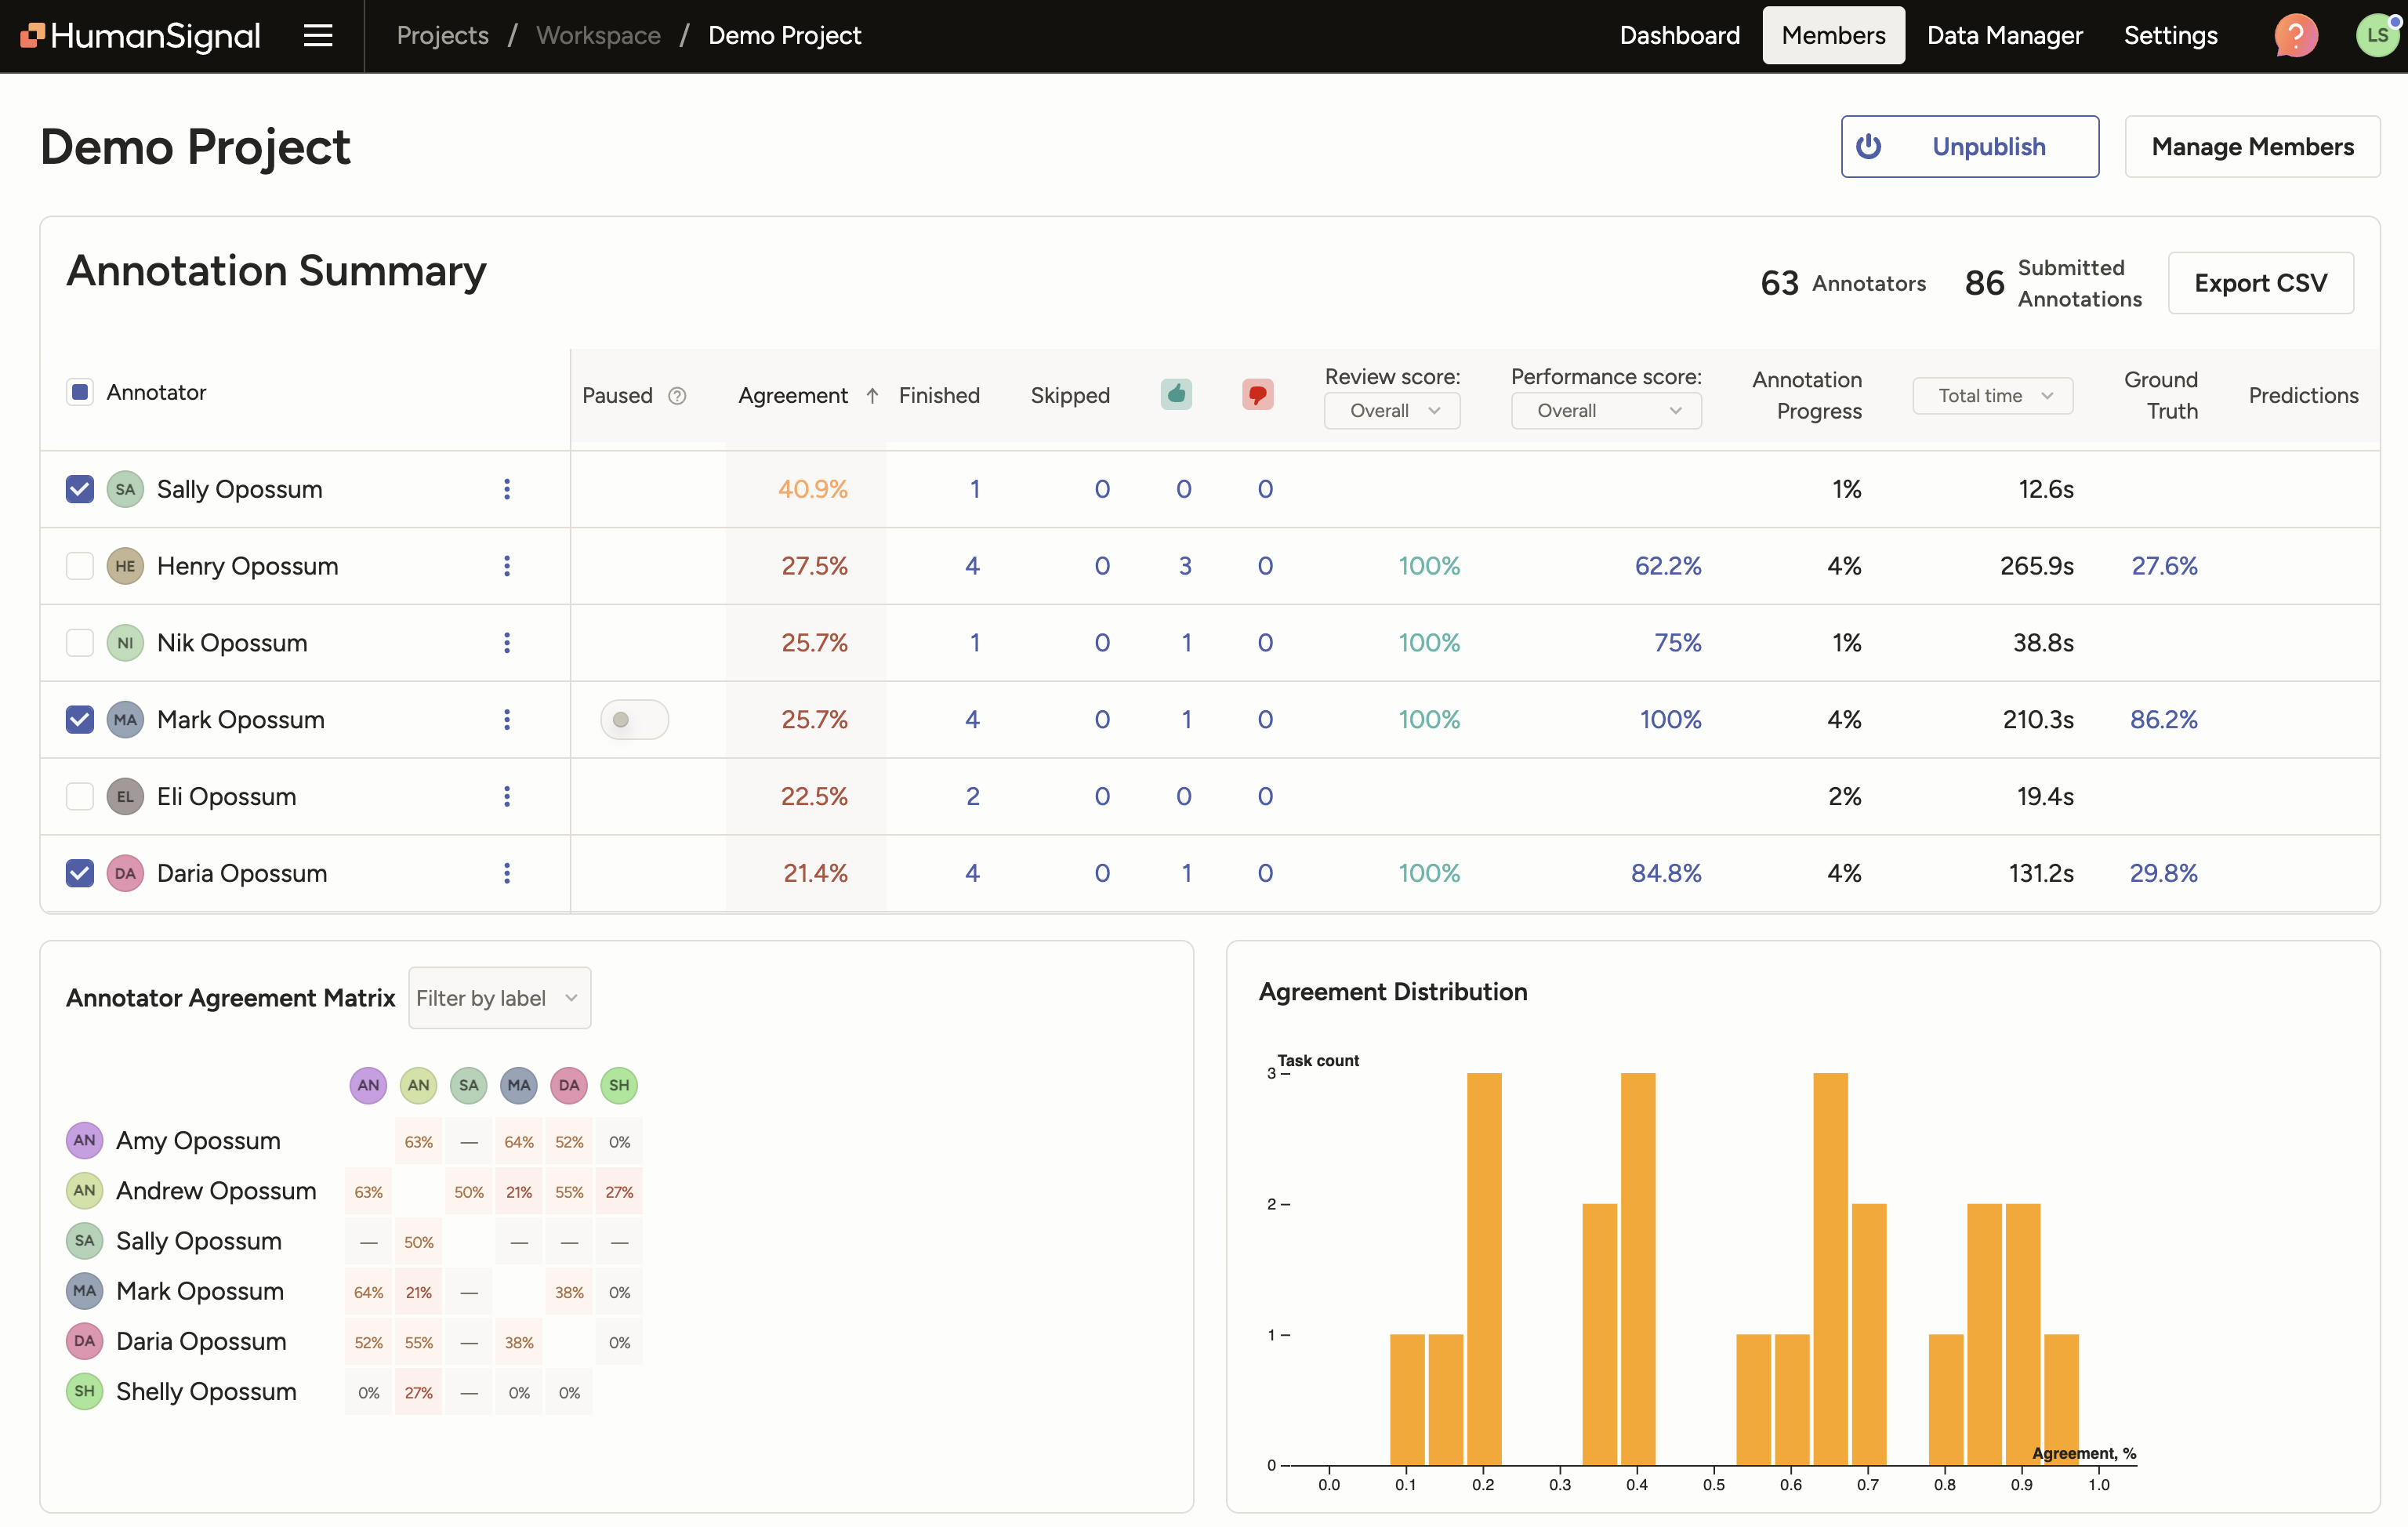
The Members dashboard gives you two views of your project’s workforce: a Performance tab with separate tables for annotators and reviewers, and an Agreement Matrix tab for inter-annotator reliability.
This can be useful in a number of ways:
- Track annotator and reviewer performance: View key metrics like agreement, acceptance score, performance score, GT agreement, and time spent to identify who is aligned or needs support.
- Monitor annotation and review progress: See how many annotations have been submitted, accepted, rejected, or are still pending review for both annotators and reviewers.
- Identify quality and consistency issues: Use the Agreement Matrix tab to spot disagreements between members, then click into cells to view the specific tasks where they diverged.
For member metrics across projects and over time, see the Member Performance dashboard.
Access the dashboard
From the project, open the Dashboard tab and select Members from the dashboard navigation.
The Data quality dashboard has two tabs:
- Performance: Review key metrics for individual annotators and reviewers in the project.
- Agreement Matrix: Compare pairwise agreement scores between members, models, and ground truth.
Filter by participants
A participant filter is available in the top right of the dashboard. By default it shows All participants.
- Annotators are listed under All Annotators; if the project has model predictions, model versions appear under All Model Versions.
- Selecting specific participants narrows both the Performance tables and the Agreement Matrix to only those members.
Performance
The Performance tab has a toggle to switch between:
- Annotations: metrics for each member’s submission activity
- Reviews: metrics for each member’s review activity
Use the Export button to download the currently visible table as a CSV.
Annotation Summary
The Annotation Summary table shows annotation metrics for each project member. The table is sortable and includes a totals row at the bottom. Use the Columns picker to show or hide columns.
| Column | Description |
|---|---|
| Annotator | Member name. Click to open this member’s Member Performance dashboard filtered to this project. |
| ID | Member’s numeric user ID. |
| Paused | Toggle to manually pause or unpause an annotator. See Pause an annotator. |
| Agreement | Average agreement score with other annotators on tasks where multiple annotations exist. |
| Assigned | Number of tasks manually assigned to the member or containing a submitted annotation by the member. |
| Pending | Number of tasks manually assigned to the member that do not yet have a submitted or skipped annotation. |
| Submitted | Total annotations submitted by the member. Includes submitted, updated, and reviewed annotations. |
| Skipped | Number of tasks skipped by the member. |
| Accepted | Number of submitted annotations accepted by reviewers. |
| Fix + Accepted | Number of submitted annotations fixed then accepted by reviewers. |
| Rejected | Number of submitted annotations rejected by reviewers. |
| Acceptance Score | Total accepted annotations divided by total reviewed annotations. |
| Performance Score | Overall annotation performance based on review outcomes (Accept, Reject, Fix+Accept). See Annotation performance summaries for the calculation. |
| Total Lead Time | Total elapsed time from task open to submit across all annotations. Includes time spent updating. |
| Avg Lead Time | Average elapsed time per submitted annotation. |
| Median Lead Time | Median elapsed time per annotation. |
| GT Agreement | Agreement between this member’s annotations and ground truth annotations on overlapping tasks. |
| Prediction Agreement | Agreement between this member’s annotations and model predictions on overlapping tasks. |
| Last Active | Date and time of the member’s most recent activity in the project. |
note
The following columns are hidden by default and can be shown using the Columns picker: ID, Assigned, Pending, Median Lead Time, Prediction Agreement.
Review Summary
The Review Summary table shows review activity for each member who has performed reviews on the project.
| Column | Description |
|---|---|
| Reviewer | Member name. Click to open this member’s Member Performance dashboard filtered to this project. |
| ID | Member’s numeric user ID. |
| Paused | Toggle to pause or unpause a reviewer. |
| Reviewed | Total annotations reviewed. Sum of accepted, fix+accepted, and rejected. |
| Pending | Number of tasks manually assigned to the reviewer that have not yet been reviewed. |
| Accepted | Number of annotations accepted by the reviewer. |
| Fix + Accept | Number of annotations fixed then accepted by the reviewer. |
| Rejected | Number of annotations rejected by the reviewer. |
| Avg time | Average time spent reviewing an annotation. Includes time spent fixing annotations. |
| Total time | Total time spent reviewing. |
| Median time | Median time spent reviewing an annotation. |
| Last active | Date and time of the reviewer’s most recent review activity. |
note
The following columns are hidden by default and can be shown using the Columns picker: ID, Performance, Submitted tasks.
note
Review time data collection began on September 25, 2025 for cloud environments, or version 2.30.0 for on-prem deployments. Filtering for earlier dates will not include review time.
Performance by Dimension
The Performance by Dimension table appears below the Annotation Summary on the Annotations sub-tab. It breaks down each member’s performance score per labeling dimension configured in the project.
Use the Compare with dropdown to choose how scores are calculated:
- Compare with GT — scores reflect each member’s agreement with ground truth annotations on overlapping tasks.
- Compare with All Annotators — scores reflect each member’s agreement with other annotators on the same tasks.
An Avg column shows each member’s overall average across all dimensions. A footer row shows the average per dimension across all members. Use the Columns picker to show or hide individual dimensions.
Agreement Matrix
The Agreement Matrix tab shows the Member / Model Agreement Matrix, a heatmap of pairwise agreement scores between all members (and models, if included via the participant filter) in the project.
Click on any cell to open the Data Manager filtered to tasks where both members annotated, so you can inspect disagreements directly.
note
Agreement in the Members dashboard reflects an agreement score between annotators, regardless of the agreement methodology configured for the project.
Filters
- Dimension: Filter agreement by a specific labeling dimension (control tag). Defaults to All dimensions.
- Label: Filter to tasks where at least one annotation contains the specified label. Only available when a specific dimension is selected.
Reading the matrix
Cells are color-coded by agreement band:
- Green — High (≥ 66%)
- Yellow — Moderate (33–66%)
- Red — Low (< 33%)
Hover over any cell to see the agreement percentage and the number of tasks where both members annotated. If a Ground Truth column is present, it shows each member’s agreement against the project’s ground truth annotations.
An Avg row at the bottom shows the average agreement per column across all members.
The participant filter (top right) applies to this tab — select specific annotators or model versions to narrow the matrix.