Task agreement
In Label Studio Enterprise, you can apply different metrics to measure agreement between annotators.
Task agreement, also known as “labeling consensus” or “annotation consensus,” shows the agreement between multiple annotators when labeling the same task.
Agreement helps you determine the quality of your dataset, its readiness to be used to train models, and assess the performance of your annotators and reviewers.
View agreement
You can view agreement in the following ways:
- Data Manager - Displays per-task agreements and inter-annotator agreement for each task. See Agreement columns in the Data Manager.
- Data quality dashboard - Displays task agreement distribution, agreement by dimension, top confusion pairs, and a confusion matrix. See Data quality dashboard.
- Members dashboard - Displays a member and model agreement matrix. See Members dashboard.
note
All agreement scores displayed in the Members Dashboard are calculated using the Pairwise methodology.
Overall vs per-control-tag agreement
Agreement is calculated at two levels:
- Per-control-tag agreement (also referred to as “question-level agreement”)
- Overall agreement
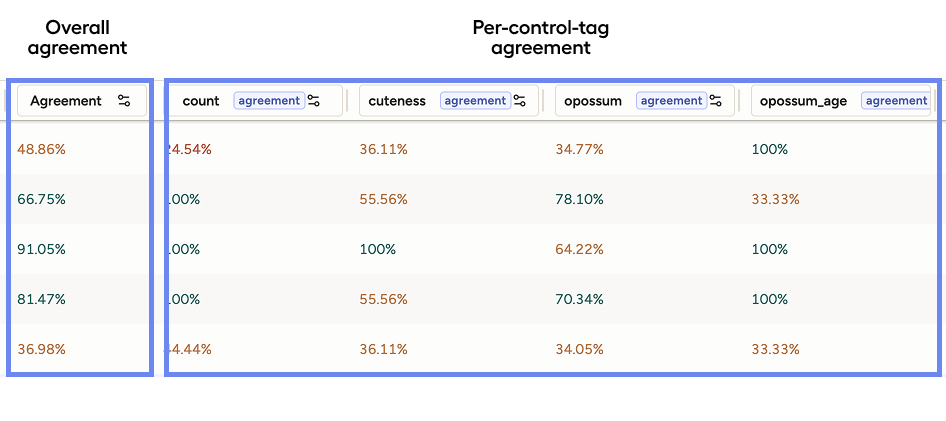
Per-control-tag agreement
Control tags are the tags that you use to annotate your data. Object tags are the tags that you use to identify the data to be annotated, such as Image, Text, and Audio.
For example, if your labeling configuration involves annotating an image with RectangleLabels, Choices, and Rating, then you would have three control tags.
Agreement is calculated for each control tag separately, and you can configure the metric used to calculate agreement for each control tag. See Built-in agreement metrics reference.
In the Data Manager, you can see an agreement score for each control tag separately. This lets you see which parts of the task have higher or lower agreement (e.g., good agreement on bounding boxes but low agreement on a choice field).
Overall agreement
Label Studio aggregates per-control-tag scores into a single task-level score.
By default, this is calculated as the mean of all control-tag scores. This is what appears in the main Agreement column when you do not filter by control tag.
You can customize how overall agreement is calculated by setting the weight of different control tags when calculating agreement.
This ensures that a critical control tag is has more bearing on the overall agreement score than a less important control tag. See Configure weight for the overall agreement.
Categorical vs. non-categorical control tags
The way agreement is calculated differs meaningfully depending on whether the control tag is categorical or non-categorical (also known as discrete and continuous respectively).
This distinction affects extraction, comparison metrics, and how scoring works.
Categorical control tags
Categorical control tags produce discrete, finite values. An annotator picks from a defined set of options.
Examples include:
- Choices (e.g., “Small”, “Medium”, “Large”)
- Rating (e.g., 1-5 stars)
Since categorical values are discrete, the typical metric is Exact Match – the two values either match (score = 1.0) or they don’t (score = 0.0).
However, tags such as Rating or Number can also use Numeric Difference with Threshold, where you define how much numeric deviation is tolerable (e.g., a threshold of 0 means only identical ratings count as a match).
Categorical comparisons inherently produce binary scores (0 or 1). This means they work with both agreement methodologies:
- Pairwise Average: Average all the 0s and 1s across annotator pairs.
- Consensus: Because the scores are already binary, no threshold conversion is needed. The consensus method naturally reflects majority agreement.
See Categorical examples for an example of how agreement is calculated for categorical control tags.
Non-categorical control tags
Non-categorical control tags produce spatial, geometric, or structural data. Annotators draw regions, highlight spans, or position elements.
For example:
- RectangleLabels (bounding boxes around objects)
- Labels (text spans / NER annotations)
- PolygonLabels, EllipseLabels, KeyPointLabels, etc.
Because two annotators rarely draw identical regions, the system uses continuous similarity metrics that measure degree of overlap. For example:
- IoU (Intersection over Union) for bounding boxes and polygons. Returns a float between
0.0(no overlap) and1.0(perfect overlap) - Span Overlap for text spans. Measures how much two highlighted text regions overlap
See Non-categorical examples for an example of how agreement is calculated for non-categorical control tags.
Summary of differences
| Aspect | Categorical Tags | Non-Categorical Tags |
|---|---|---|
| Output type | Discrete values (labels, ratings) | Spatial/structural data (boxes, spans) |
| Typical metrics | Exact Match, Numeric Difference | IoU, Span Overlap |
| Score type | Binary (0 or 1) |
Continuous (0.0 to 1.0) |
| Pairwise | Works directly; averages binary scores | Works directly; averages continuous scores |
| Consensus | Works directly; no threshold needed | Requires a user-defined threshold to binarize scores first |
Methodology
You can configure the methodology to use for each project under Settings > Quality > Agreement section.
You have the following methodologies to choose from:
Consensus: Consensus measures “What percentage of annotators chose the most common answer?”
Pairwise: Pairwise measures “What is the average agreement score across all pairs of annotators?”
Tip
You can switch between methodologies at any time.
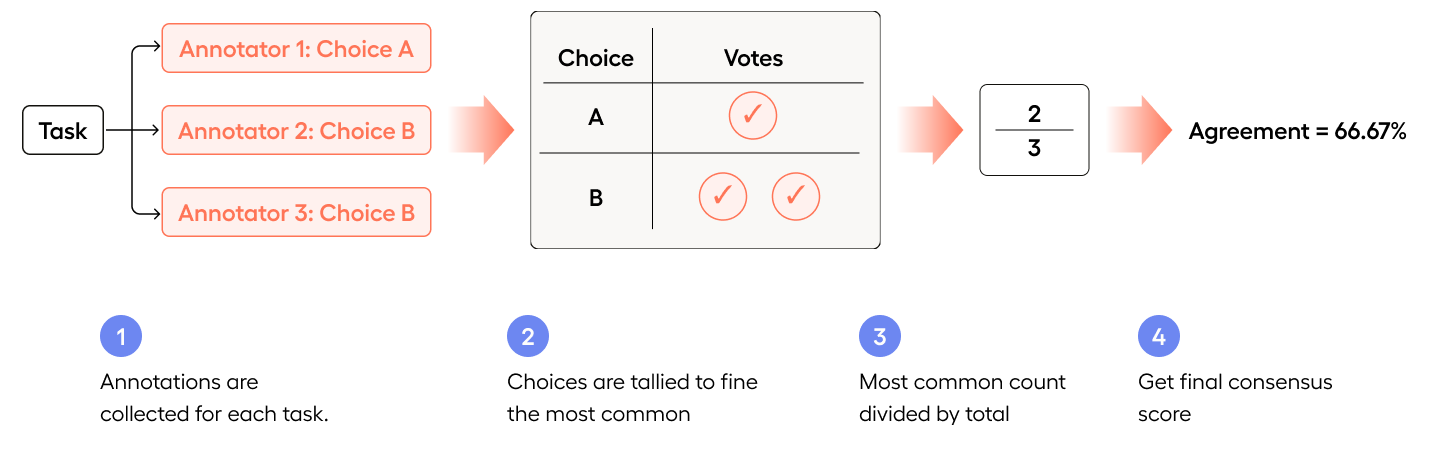
Consensus
Agreement is calculated across all annotators at once, measuring how much they converge to a common answer.
There are two equally valid ways to look at consensus:
- How many annotators agree?
and
- How many annotators chose the most common answer?
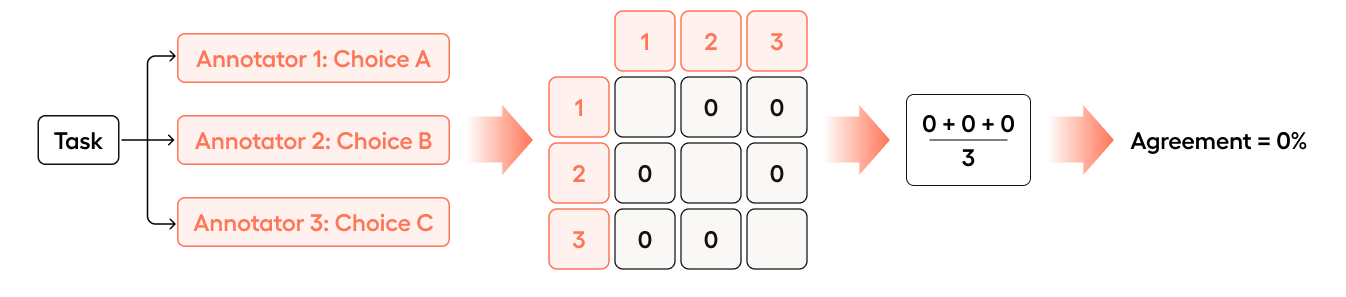
The easiest way to illustrate this is an example where each annotator selects a different choice:
- Annotator 1 chooses A
- Annotator 2 chooses B
- Annotator 3 chooses C
Even though none of the annotators agreed with each other, agreement is still 1/3 = 33.33%.
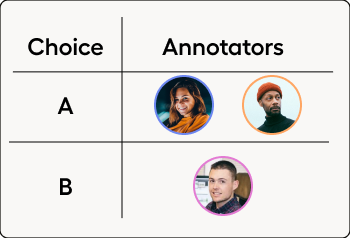
How many annotators agree?
Given three annotators, 1/3 selected each choice:
1/3 = 33.33%How many annotators chose the most common answer?
In this case, A, B, and C were each chosen once, and are therefore equally common.
So 1 out of 3 annotators chose the most common answer:
1/3 = 33.33%
If you were to switch to Pairwise methodology, the same task would have an agreement score of 0%, as Pairwise is more focused on how much agreement there is between pairs of annotators.
Binary scoring in Consensus
Consensus measures agreement with binary scores – each pair of annotators either matches (1) or does not match (0).
For categorical tags like Choices or Rating, this binary outcome happens naturally: two annotators either selected the same value or they didn’t.
For non-categorical tags like bounding boxes or text spans, the raw comparison produces a continuous score (e.g., IoU of
0.82). Therefore for non-categorical tags, you must define a threshold to determine whether the continuous score is high enough to be considered a match, allowing Label Studio to convert it into a binary decision.At or above the threshold counts as a match (
1), below it does not (0).
Once annotations have been reduced to a 1 or 0, consensus calculates how much the group converges overall.
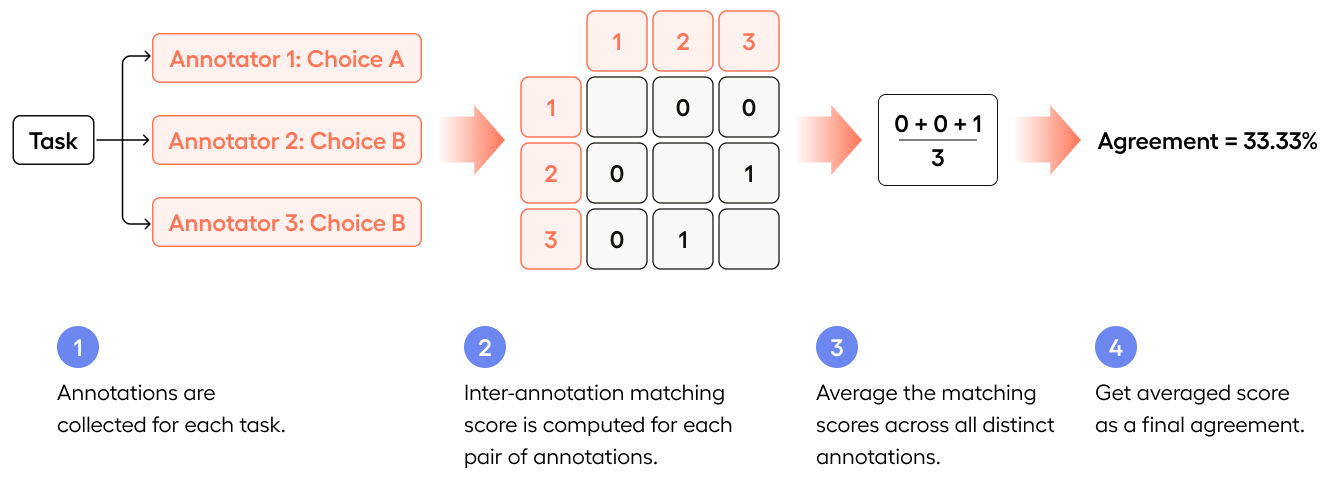
Pairwise
As the name “Pairwise” indicates, Pairwise looks at agreement between every unique pair of annotators, and then averages that agreement.
Pairwise measures agreement by comparing every unique pair of annotators independently, calculating a score for each pair, and then averaging all those scores together.
Given the same example earlier:
- Annotator 1 chooses A
- Annotator 2 chooses B
- Annotator 3 chooses C
While the Consensus agreement score was 33.33%, the Pairwise agreement score is 0%.
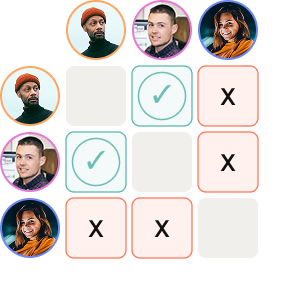
- Annotator 1 is compared with Annotator 2 (no match =
0) - Annotator 1 is compared with Annotator 3 (no match =
0) - Annotator 2 is compared with Annotator 3 (no match =
0)
(0 + 0 + 0)/3 = 0
For categorical tags, each pair produces a binary result: a match scores 1 and a mismatch scores 0. The average of these binary values becomes the overall agreement.
For non-categorical tags like bounding boxes, each pair produces a continuous score (e.g., an IoU of 0.82), and these raw scores are averaged directly without any threshold conversion.
This means Pairwise preserves the full granularity of non-categorical comparisons, rewarding partial overlap rather than reducing it to all-or-nothing.
Tip
For non-categorical tags using Consensus methodology, you must use either exact match or a continuous metric that has a threshold. For Pairwise, you can use exact match, a continuous metric without a threshold, or a continuous metric with a threshold.
Consensus vs. Pairwise at a glance
| Pairwise | Consensus | |
|---|---|---|
| How it works | Compares every unique pair of annotators, scores each pair, and averages all pair scores | Measures how much the full group converges toward a common answer using binary match/no match |
| Score type used | Uses raw scores directly (binary for categorical, continuous for non-categorical) | Always requires binary scores (match or no match) |
| Threshold needed? | No – works with raw scores as-is | Only for non-categorical tags; categorical tags are already binary |
| Partial credit | Yes – a bounding box overlap of 0.6 contributes 0.6 to the average | No – overlap is either above the threshold (match) or below it (no match) |
| Sensitivity to outliers | High – one disagreeing annotator creates multiple low-scoring pairs, pulling the average down | Low – one disagreeing annotator is outvoted by the majority |
| 3 annotators, 2 agree (categorical) | 33% (only 1 of 3 pairs match) | 66% (majority agreement recognized) |
| 3 annotators, all agree | 100% | 100% |
| 3 annotators, none agree | 0% | 33% (1 out of 3 annotators chose the most common answer) |
| Best suited for | Projects with 2 annotators per task, or when you want granular continuous scores | Projects with 3+ annotators per task, or when majority agreement matters most |
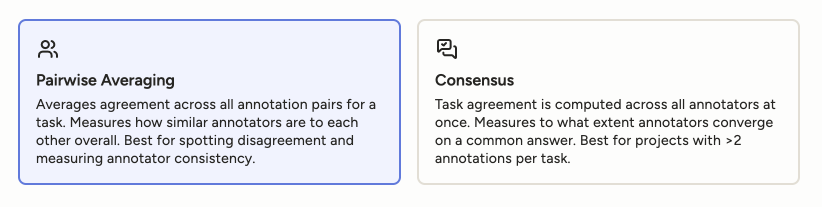
When to select Pairwise vs. Consensus
In extremely simple terms:
- Pairwise is best if you’re more focused on your annotators.
- Consensus is best if you’re more focused on whether the majority of annotators agree on a particular answer.
Pairwise
Pairwise tells you how much annotators agree with each other overall.
Best for when you care about assessing your annotators, want to understand inconsistencies/fragmentation in the annotation pool, and find ambiguity in your tasks and/or instructions.
Can be more sensitive to outliers which could be desired (a single disagreeing annotator can significantly lower the score)
Pairwise does not require you to define thresholds for non-categorical control tags (e.g.
RectangleLabelsandTextArea), and so might be simpler to set up in those cases.
Consensus
Consensus tells you how strongly the task converged on one answer.
Better reflects majority agreement and is more intuitive for most users.
More robust to outliers (a single disagreeing annotator has less impact).
The Consensus measurement is a good proxy for label stability and task convergence.
Requires thresholds for non-categorical control tags. Thresholds are how you define what “close enough” means. See Non-categorical examples for an of consensus calculation with a threshold.
Examples
Categorical examples
Categorical control tags are control tags that have a fixed set of choices. For example, a control tag that has the choices “Opossum”, “Cat”, “Hamster”.
Say you have 3 annotators select between 3 different choices: “A”, “B”, “C”.
If all three annotators select a different choice, Pairwise is 0:
- Annotator 1 is compared with Annotator 2 (no match =
0) - Annotator 1 is compared with Annotator 3 (no match =
0) - Annotator 2 is compared with Annotator 3 (no match =
0)
(0 + 0 + 0)/3 = 0
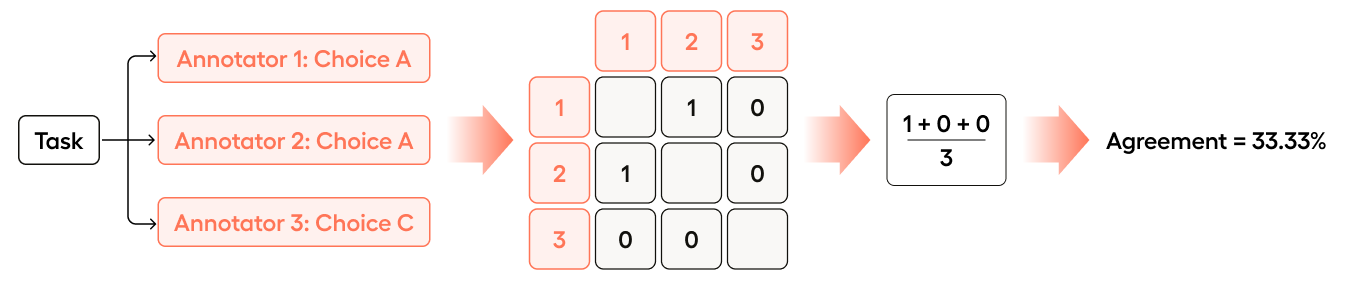
If Annotator 2 were to change their choice to agree with Annotator 1, the agreement would change to 33.33%:
- Annotator 1 is compared with Annotator 2 (match =
1) - Annotator 1 is compared with Annotator 3 (no match =
0) - Annotator 2 is compared with Annotator 3 (no match =
0)
(1 + 0 + 0)/3 = .33
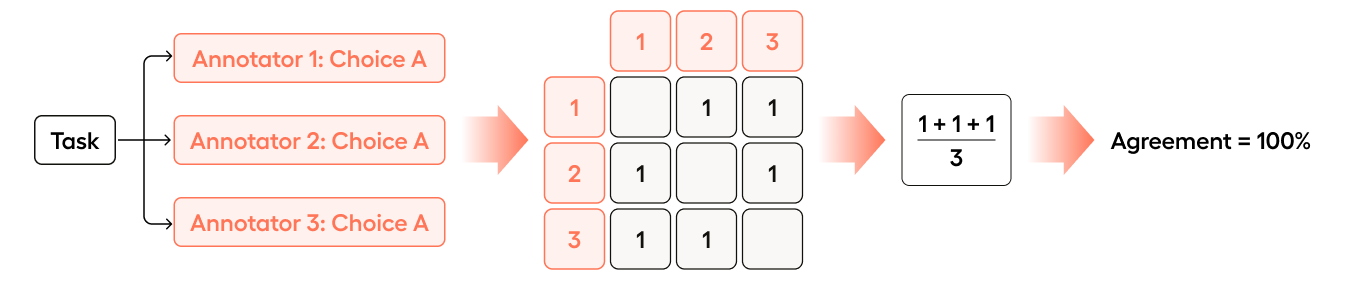
If Annotator 3 were to change their choice to agree with Annotator 1 and Annotator 2, the agreement would change to 100%:
- Annotator 1 is compared with Annotator 2 (match =
1) - Annotator 1 is compared with Annotator 3 (match =
1) - Annotator 2 is compared with Annotator 3 (match =
1)
(1 + 1 + 1)/3 = 1
As you can see, Pairwise might not be as intuitive as Consensus (e.g. going from 33.33% to 100% when Annotator 3 changes their choice), but it is more sensitive to outliers.
Say you have 3 annotators select between 3 different choices: “A”, “B”, “C”.
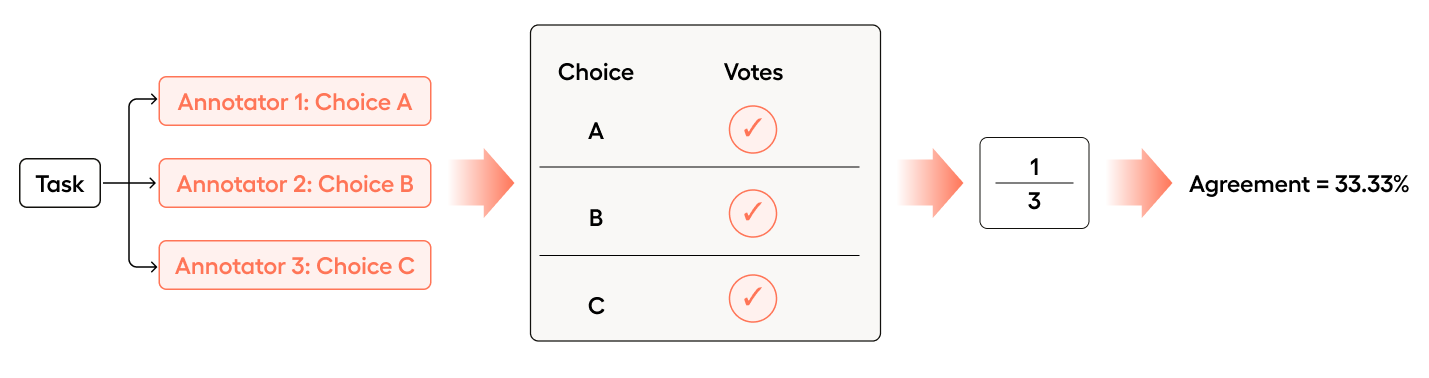
If all three annotators select a different choice, Consensus is 33.33%:
- Annotator 1 chose “A”
- Annotator 2 chose “B”
- Annotator 3 chose “C”
In Consensus, we are looking at the most common answer. In this case, A, B, and C were each chosen once, and are therefore equally common.
So 1 out of 3 annotators chose the most common answer (1/3 = .33).
- It does not matter what the value of their choice was, just that there are 3 choices and no overlapping choice between annotators.
- In this case, any one of the choices becomes the “most common answer” as they are all equally common (all were selected once).
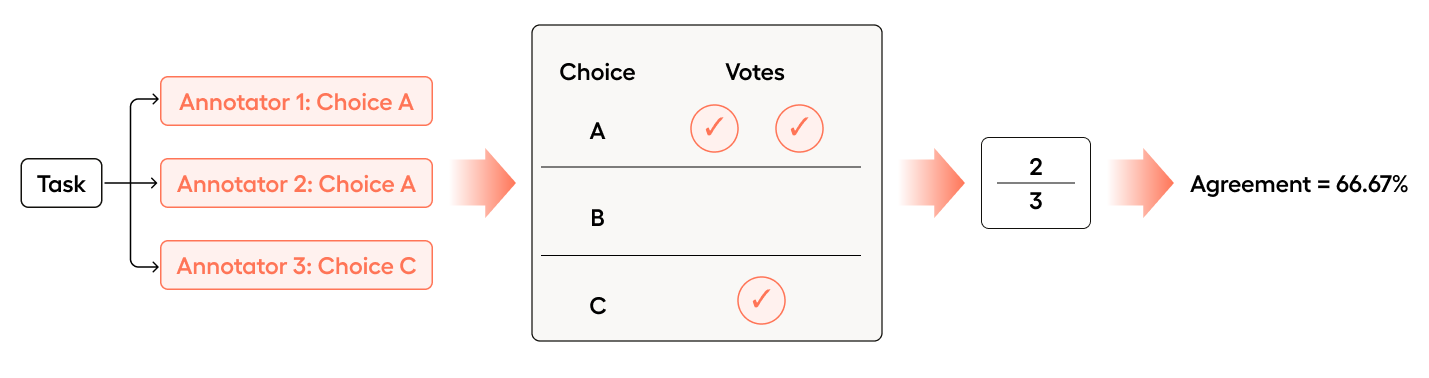
If Annotator 2 were to change their choice to agree with Annotator 1, the agreement would increase to 66.67%:
- Annotator 1 chose “A”
- Annotator 2 chose “A”
- Annotator 3 chose “C”
In this case, A was chosen twice and C was chosen once.
So 2 out of 3 annotators chose the most common answer (2/3 = .66).
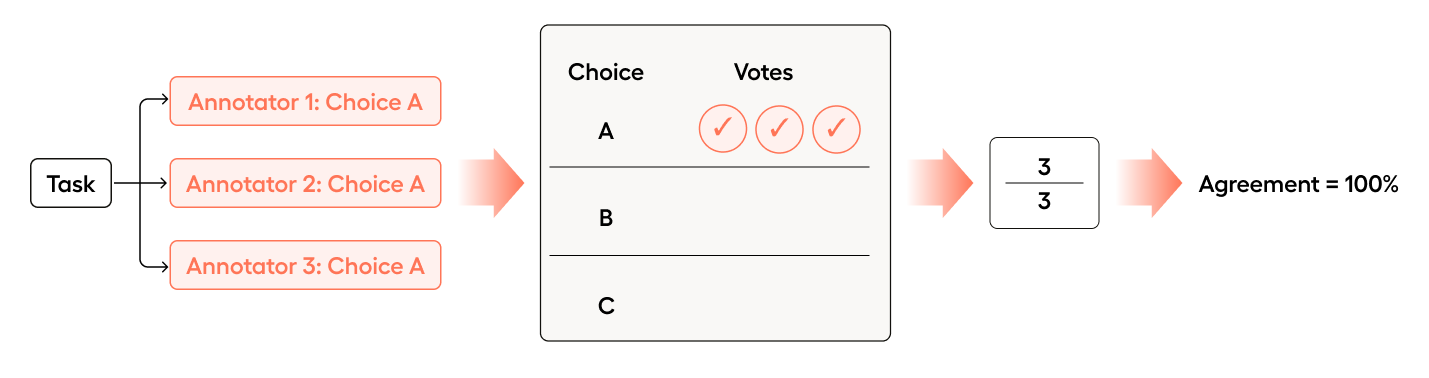
If Annotator 3 were to change their choice to agree with Annotator 1 and Annotator 2, the agreement would increase to 100%.
All 3 annotators chose the most common answer (3/3 = 1.0).
Non-categorical examples
Non-categorical control tags are control tags have continuous values that are not as simple to quantify as “match” or “no match”. For example, RectangleLabels, PolygonLabels, and Labels.
Bounding boxes
When you’re annotating an image with bounding boxes, you can use the Exact Match, Intersection over Union (IoU) or Intersection over Union (IoU) (Threshold) metrics.
In this example, we’ll look at Intersection over Union (IoU) and Intersection over Union (IoU) (Threshold).
Intersection over Union, or IoU, is a way to say how similar two bounding boxes are.
The idea is:
- Intersection: The area shared by both boxes
- Union: The total area covered by both boxes together
For more information on how IoU is calculated, see Intersection over Union (IoU).
For more information on thresholds, see the following video:
Say you have 3 annotators drawing boxes using RectangleLabels. You are using the Intersection over Union (IoU) metric to calculate agreement.
If all three annotators draw their boxes in completely different areas of the image with no overlap, Pairwise is 0%:
- Annotator 1 is compared with Annotator 2 (no overlap, IoU =
0) - Annotator 1 is compared with Annotator 3 (no overlap, IoU =
0) - Annotator 2 is compared with Annotator 3 (no overlap, IoU =
0)
(0 + 0 + 0) / 3 = 0
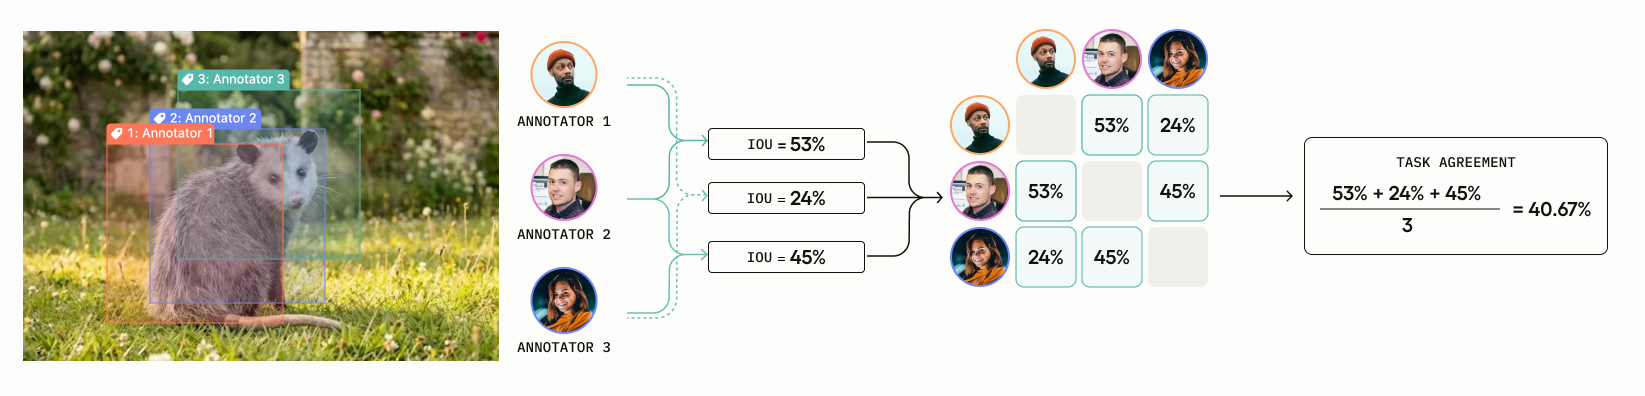
Now the annotators adjust their boxes so that there is some overlap between them. In this case, the agreement is 40.67%:
- Annotators 1 vs Annotator 2 (IoU =
.53) - Annotators 1 vs Annotator 3 (IoU =
.24) - Annotators 2 vs Annotator 3 (IoU =
.45)
(.53 + .24 + .45) / 3 = 40.67%
Say you have 3 annotators drawing boxes using RectangleLabels.
However, Consensus requires binary (0 or 1) scores. So this time, you are using the Intersection over Union (IoU) (Threshold) metric to calculate agreement.
This is the same as the Intersection over Union metric used in the Pairwise example, but with a threshold applied. A threshold is necessary to determine what is considered a match (1) and what is not a match (0).
Let’s say you set the threshold to 50%: any pair with IoU >= 0.50 counts as a match (1), and anything below is not a match (0).
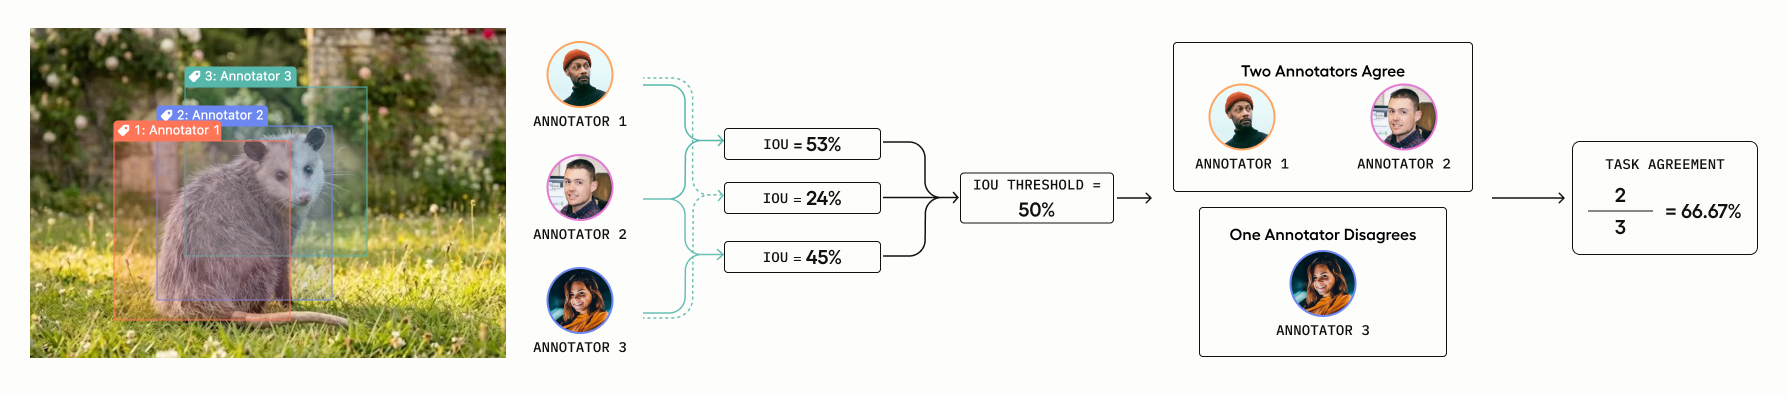
You have the following raw IoU scores:
- Annotators 1 vs Annotator 2 (IoU =
.53) - Annotators 1 vs Annotator 3 (IoU =
.24) - Annotators 2 vs Annotator 3 (IoU =
.45)
Binarize using the threshold (50%):
- Annotators 1 vs Annotator 2:
.53>=.50→ match = 1 - Annotators 1 vs Annotator 3:
.24<=.50→ no match = 0 - Annotators 2 vs Annotator 3:
.45<=.50→ no match = 0
Annotator 1 and Annotator 2 agree, giving us a consensus score of 2/3 = .66.
Stronger IoU agreements
There will be situations where there is more agreement than simply 2 annotators agreeing, but less than all three agreeing.
For example, in the following image:
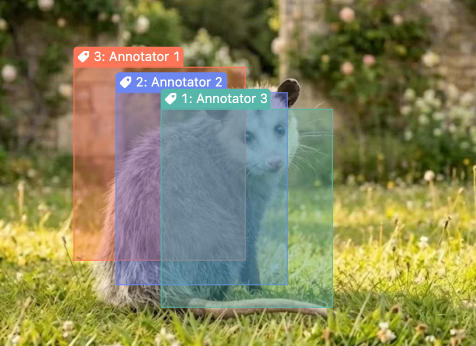
- Annotator 1 and Annotator 2 have strong overlap
- Annotator 2 and Annotator 3 have strong overlap
- Annotator 1 and 3 have weak overlap
In these cases, the agreement will be higher to reflect that there is stronger agreement than a simple 2/3 consensus. (In the example above, the agreement score is 80.47%.)
Text spans
When you’re labeling text spans, you can use the Exact Match, Span Overlap or Span Overlap (Threshold) metrics.
In this example, we’ll look at Span Overlap and Span Overlap (Threshold).
Span Overlap measures how much annotators’ highlighted regions coincide. For more information on how it’s calculated, see Span Overlap.
You have three annotators who are highlighting text spans to label as “Positive” or “Negative.”
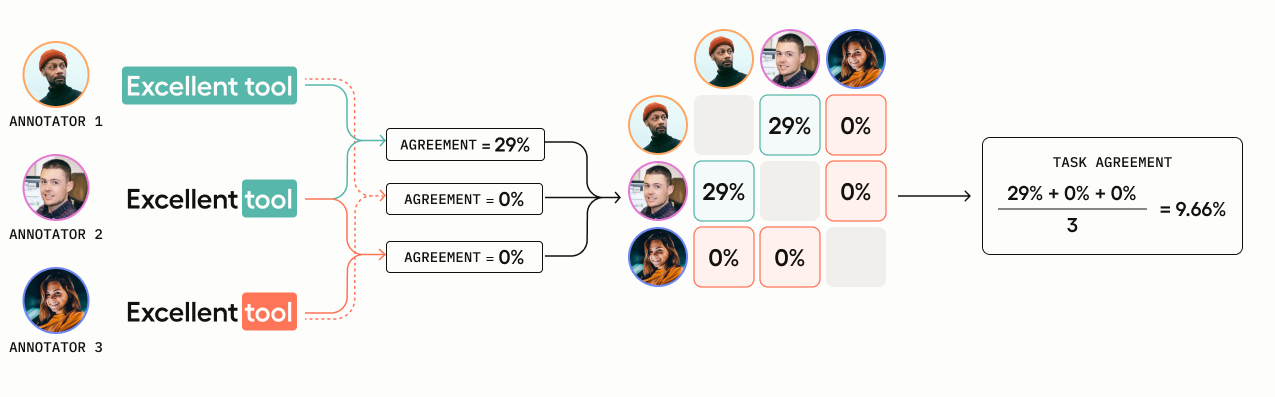
- Annotator 1 selects “Positive” and highlights the span
Excellent tool= characters 0-14 - Annotator 2 selects “Positive” and highlights the span
tool= characters 10-14 - Annotator 3 selects “Negative” and highlights the span
tool= characters 10-14
Annotator 3’s overlap is negated because she chose a different label for her text span.
- Annotator 1 is compared with Annotator 2: overlap is
4/14 = .29 - Annotator 1 is compared with Annotator 3: overlap is
0because they chose different labels - Annotator 2 is compared with Annotator 3: overlap is
0because they chose different labels
(.29 + 0 + 0) / 3 = 0.0966
You have three annotators who are highlighting text spans to label as “Positive” or “Negative.”
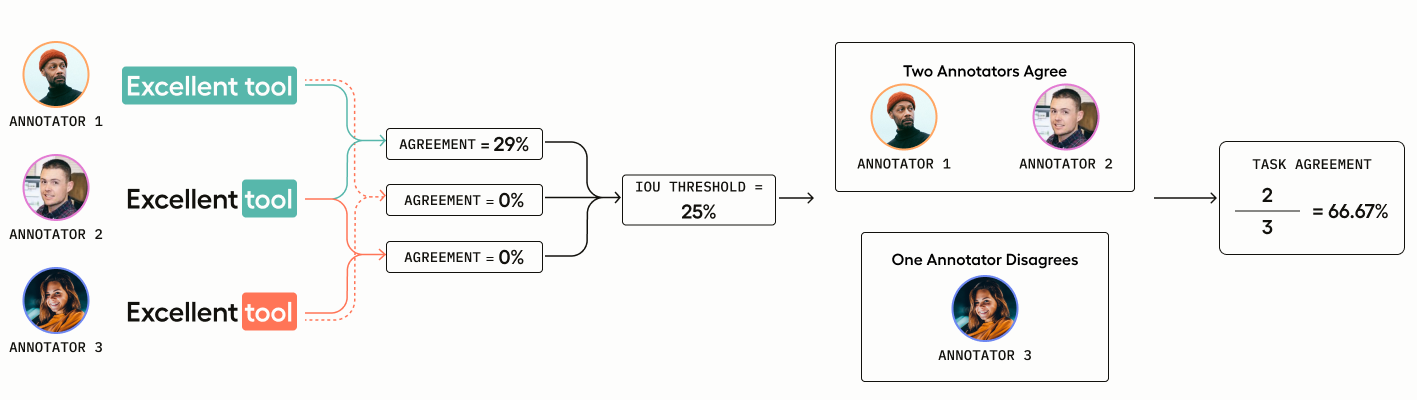
- Annotator 1 selects “Positive” and highlights the span
Excellent tool= characters 0-14 - Annotator 2 selects “Positive” and highlights the span
tool= characters 10-14 - Annotator 3 selects “Negative” and highlights the span
tool= characters 10-14
Annotator 3’s overlap is negated because she chose a different label for her text span.
Annotator 1 and 2 have 29% overlap (4/14 = .29).
However, Consensus requires binary (0 or 1) scores to determine match, which is why you have to select a threshold for non-categorical tags.
In this case, the threshold is set quite low to 25%, meaning the annotations submitted by Annotator 1 and Annotator 2 are considered a match.
Therefore, 2 out of 3 annotators agree, which gives us an agreement score of (2/3 = .66).
You can find additional examples in the built-in metrics reference.
Other agreement settings
With methodology selected, you can configure other settings for agreement under Settings > Quality > Agreement
Built-in vs custom metrics
Under Built-in Metrics vs Custom, you can select whether you want to customize your own agreement metrics or use the built-in metrics.
Built-In Agreement Metrics - If you select Built-in metrics, you will see the built-in metrics listed in the built-in metrics reference.
Custom Agreement Metrics - If you select Custom metrics, you will be able to create your own custom metrics for agreement by writing code in the text box. See Add a custom agreement metric to Label Studio.
Configure weight for the overall agreement
Overall agreement is the average of all control tag agreement scores. It is displayed in the main Agreement column in the Data Manager.
Under Settings > Quality > Agreement > Overall Agreement, you can customize how overall agreement is calculated by setting the weight of different control tags when calculating agreement.
This ensures that a critical control tag has more bearing on the overall agreement score than a less important control tag.
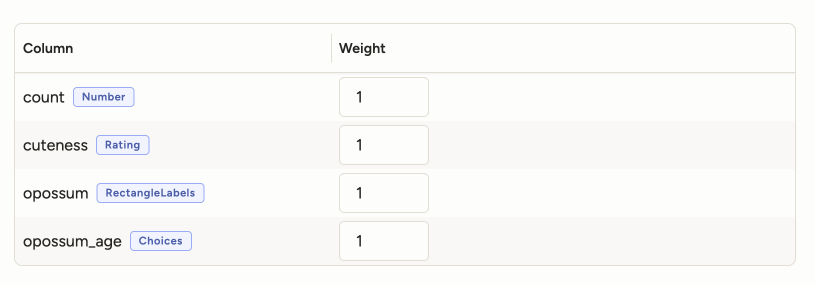
For example, if you have a project with the following control tags and weights:
- RectangleLabels: 1.0
- Choices: 0.3
- Rating: 0.2
And the following per-control-tag agreement scores for a task:
- RectangleLabels: 83%
- Choices: 33%
- Rating: 33%
Then the overall agreement is calculated as:
(1.0 * 83% + 0.3 * 33% + 0.2 * 33%) / (1.0 + 0.3 + 0.2) = 60.67%
Configure agreement for each control tag
Under Settings > Quality > Agreement > Agreement Columns, you can customize how agreement is calculated for each control tag.
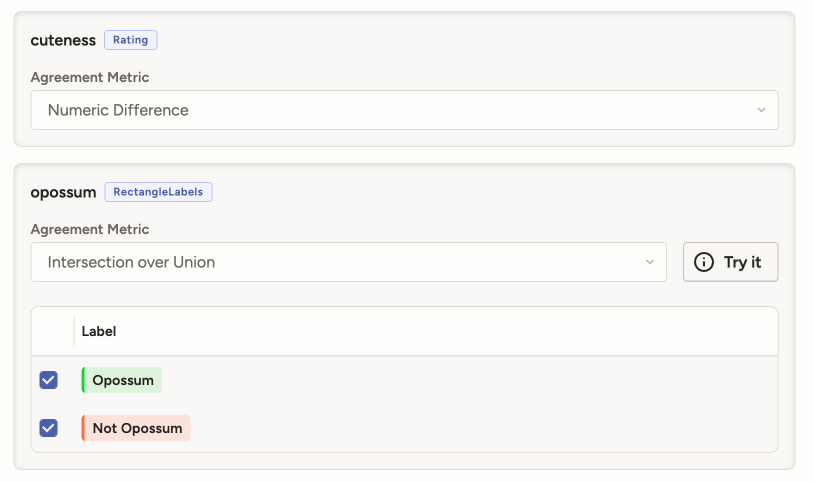
Your options depend on the agreement methodology you have selected and what type of control tag you are configuring.
For information on the different metrics available for each control tag, see the built-in metrics reference.